USC Course & Professor Data — From Raw Data to Course Selection Insights
Purpose
Help students, families, and faculties to draw actionable insights (choice of class/instructor, fit, workload, assessment style, feedback) using ratings and official evaluation context at USC.
Data Sub-Genre
Professor & Course Ratings (Rate My Professors, Coursicle, Official Context-Syllabus)
Raw Data per Professor
Fields: Professor, Department, Course (description), Attendance, Tags, Overall Quality (0–5), Level of Difficulty (1–5), Would Take Again (%), Comments.
Raw Data per Course
Fields: Evaluation of official USC syllabus (learning objectves, grading breakdown, attendence) and comments.
 Resource A — Rate My Professors (RMP)
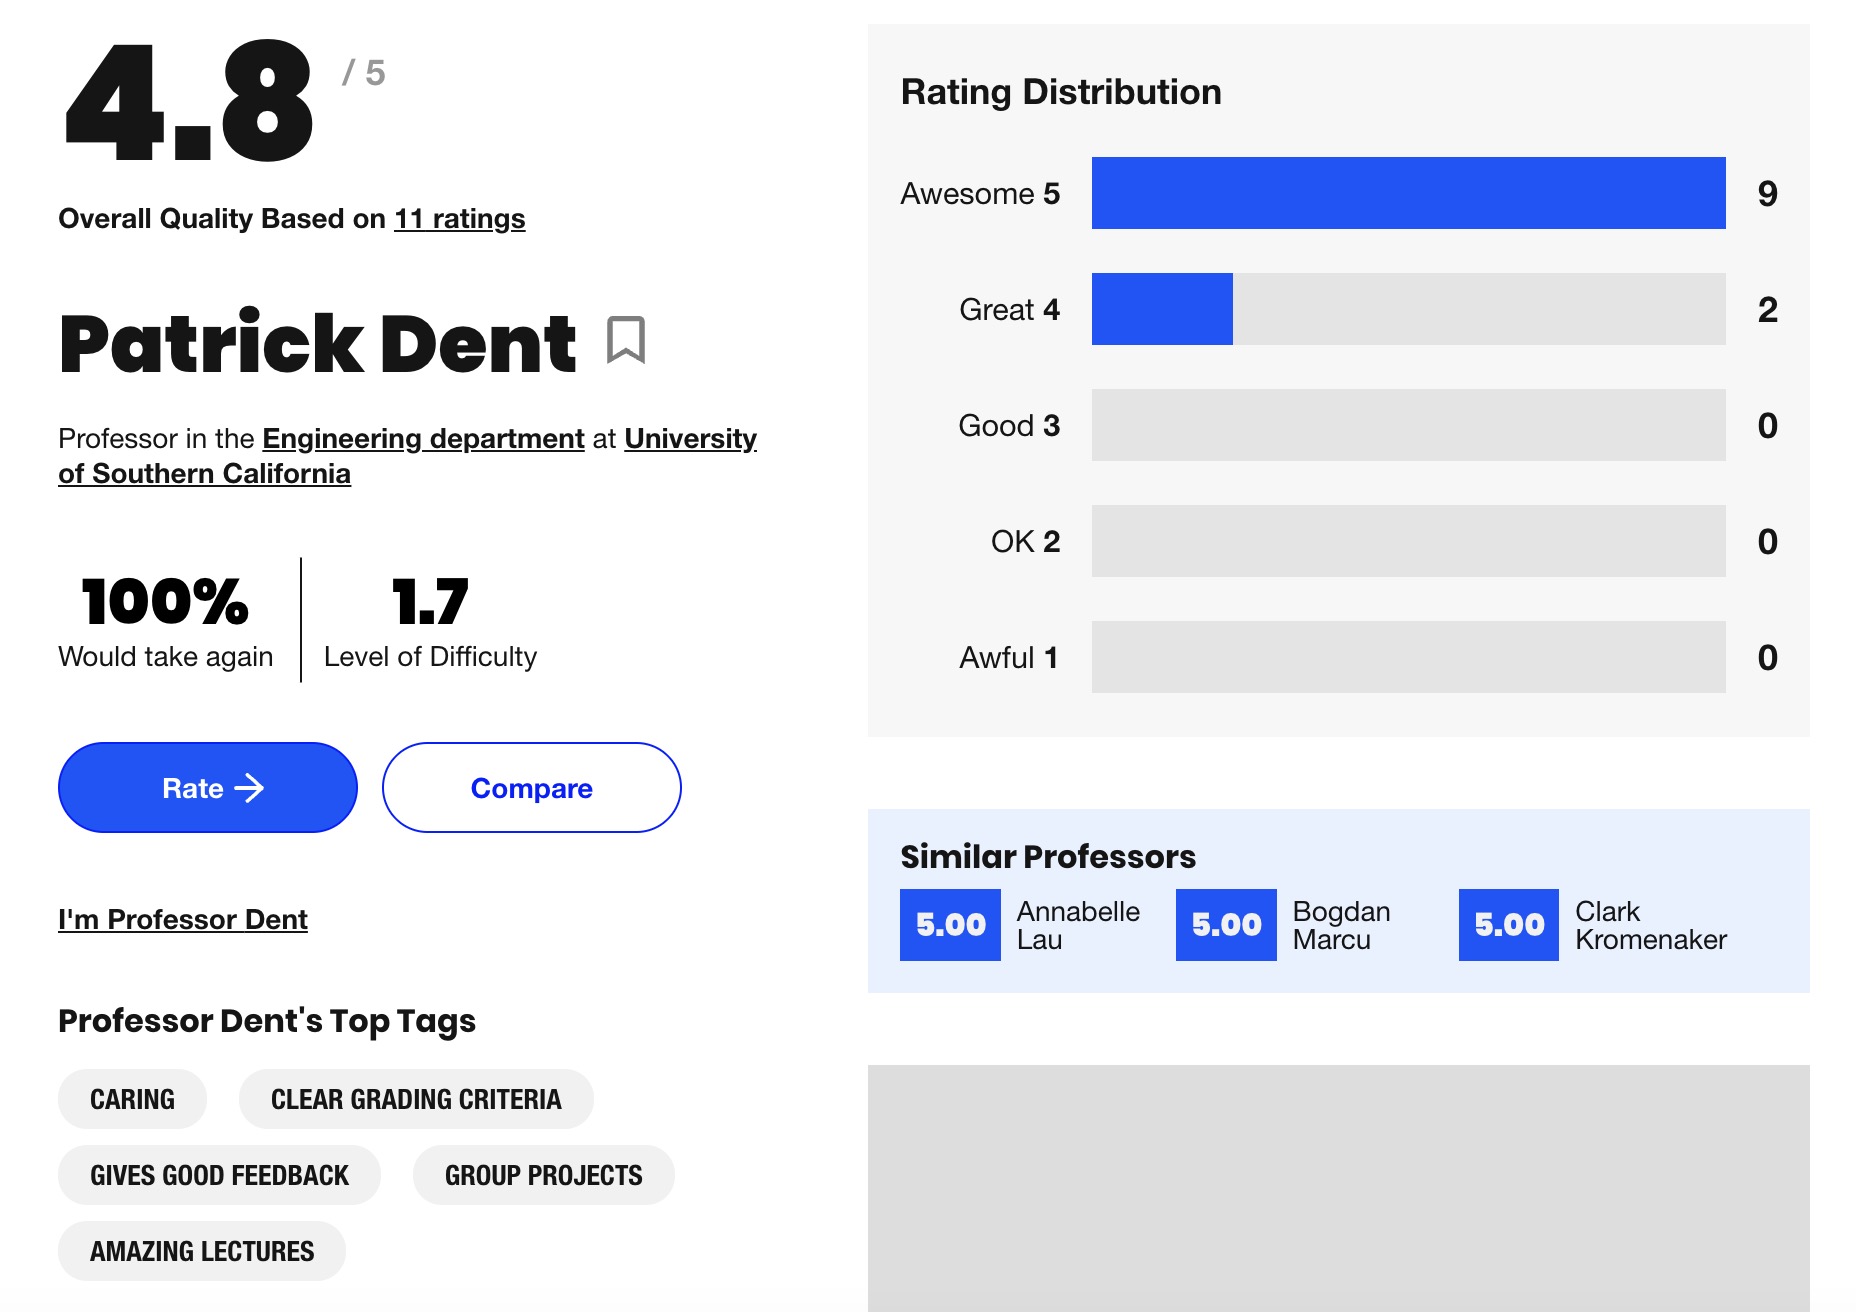
RMP USC Professor Search Landing Page
How to Use & Insights
For students and families, they can compare average rating and difficulty across instructors teaching the same course; scan tags for teaching style to see if it fits (e.g., “Test Heavy, Gives Good Feedback”). Given that many of the classes provide the same units/credits (GEs, WRITs), it is reasonable for students to choose the easier instructor.
From the data, we could gain the knowledge:
- Harder often = lower rating. In a researched sample of USC, there’s a moderate negative association between difficulty and overall rating.
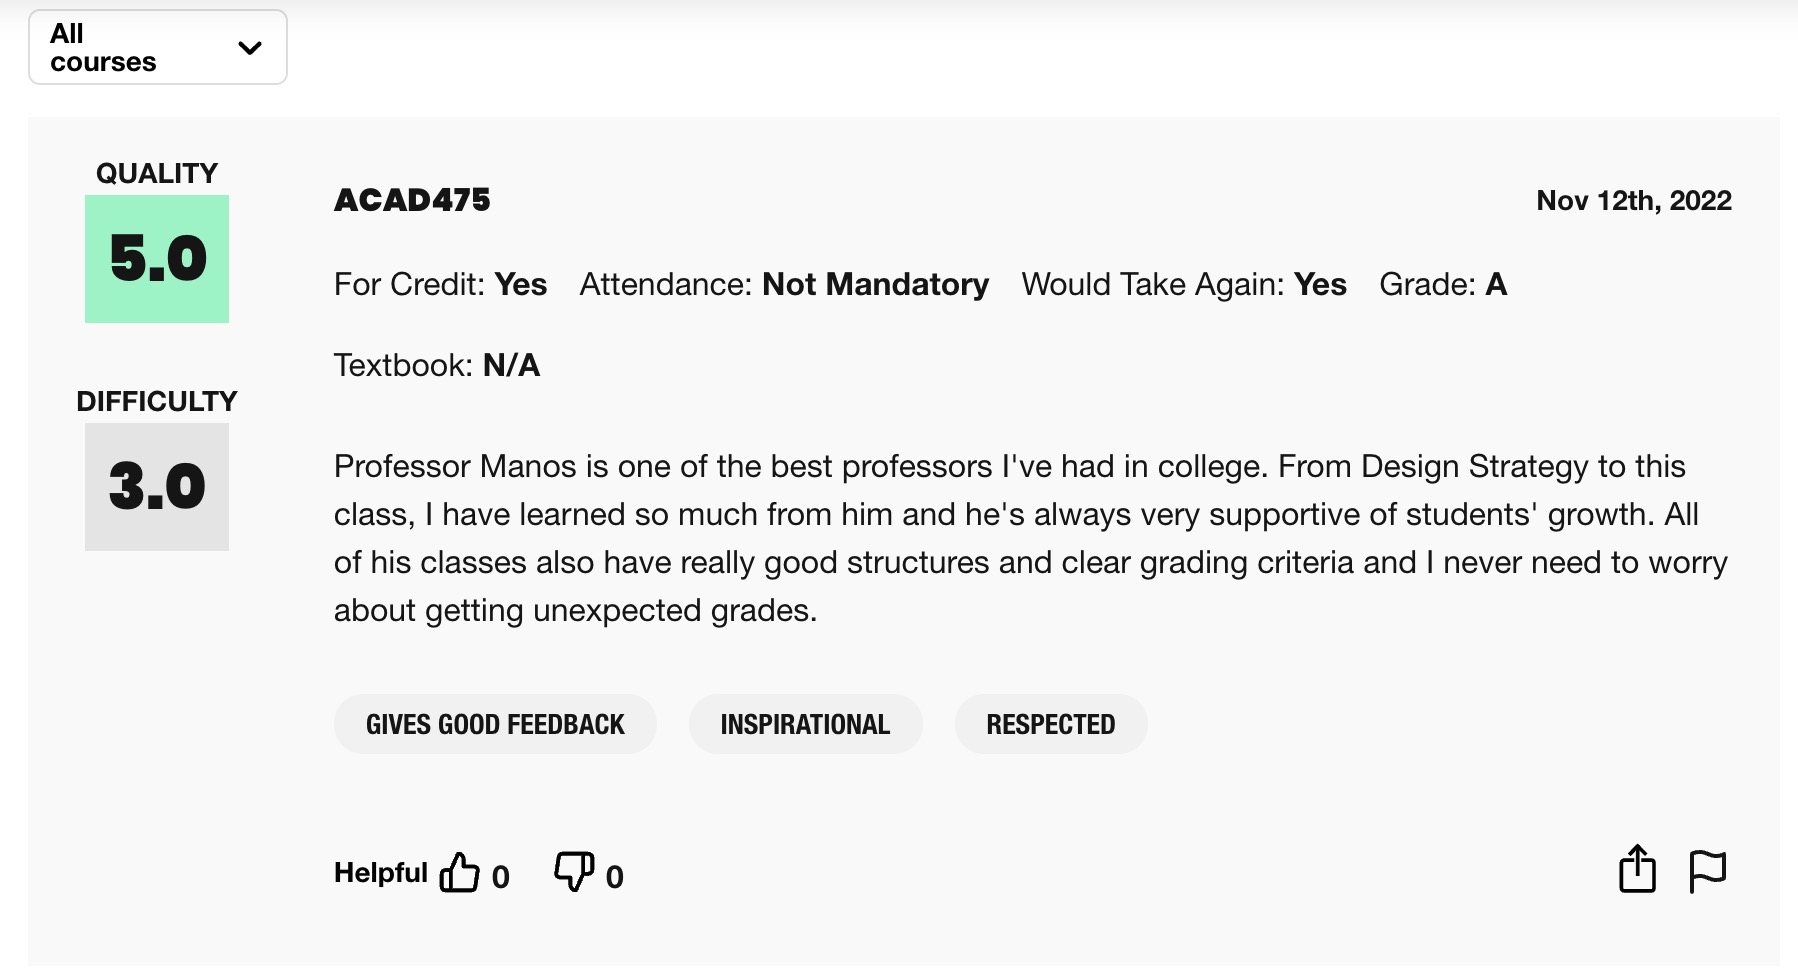
- Tags like “Amazing Lectures,” “Caring,” “Clear Grading Criteria,” and “Gives Good Feedback” frequently appear with higher quality. On the other hand, tags like “Tough Grader” and “Test Heavy” tend to cluster on lower-quality pages.
- Rating stability grows with volume. Many of the courses have a sample that is too small to be statistically significant.
- Workload bias exists. Students often factor perceived workload into how they rate “quality,” which can cause systematic bias evaluations.
This means that students should prioritize instructors with more reviews and recent comments and treat outliers skeptically. Students should also be skeptical toward outliers and note potential biases like confirmation and systematic biases, as the ratings aren’t an accurate reflection of the course nor could they represent the entire population. That being said, faculties don’t have to take consideration of those negative reviews but should focus on the positive reviews. This would help the department and professors to know what students are looking for, with tags like “Fast Email Response” and “Clear Grading Criteria.”
 Resource B — Coursicle
Data fields per course:
Comments only
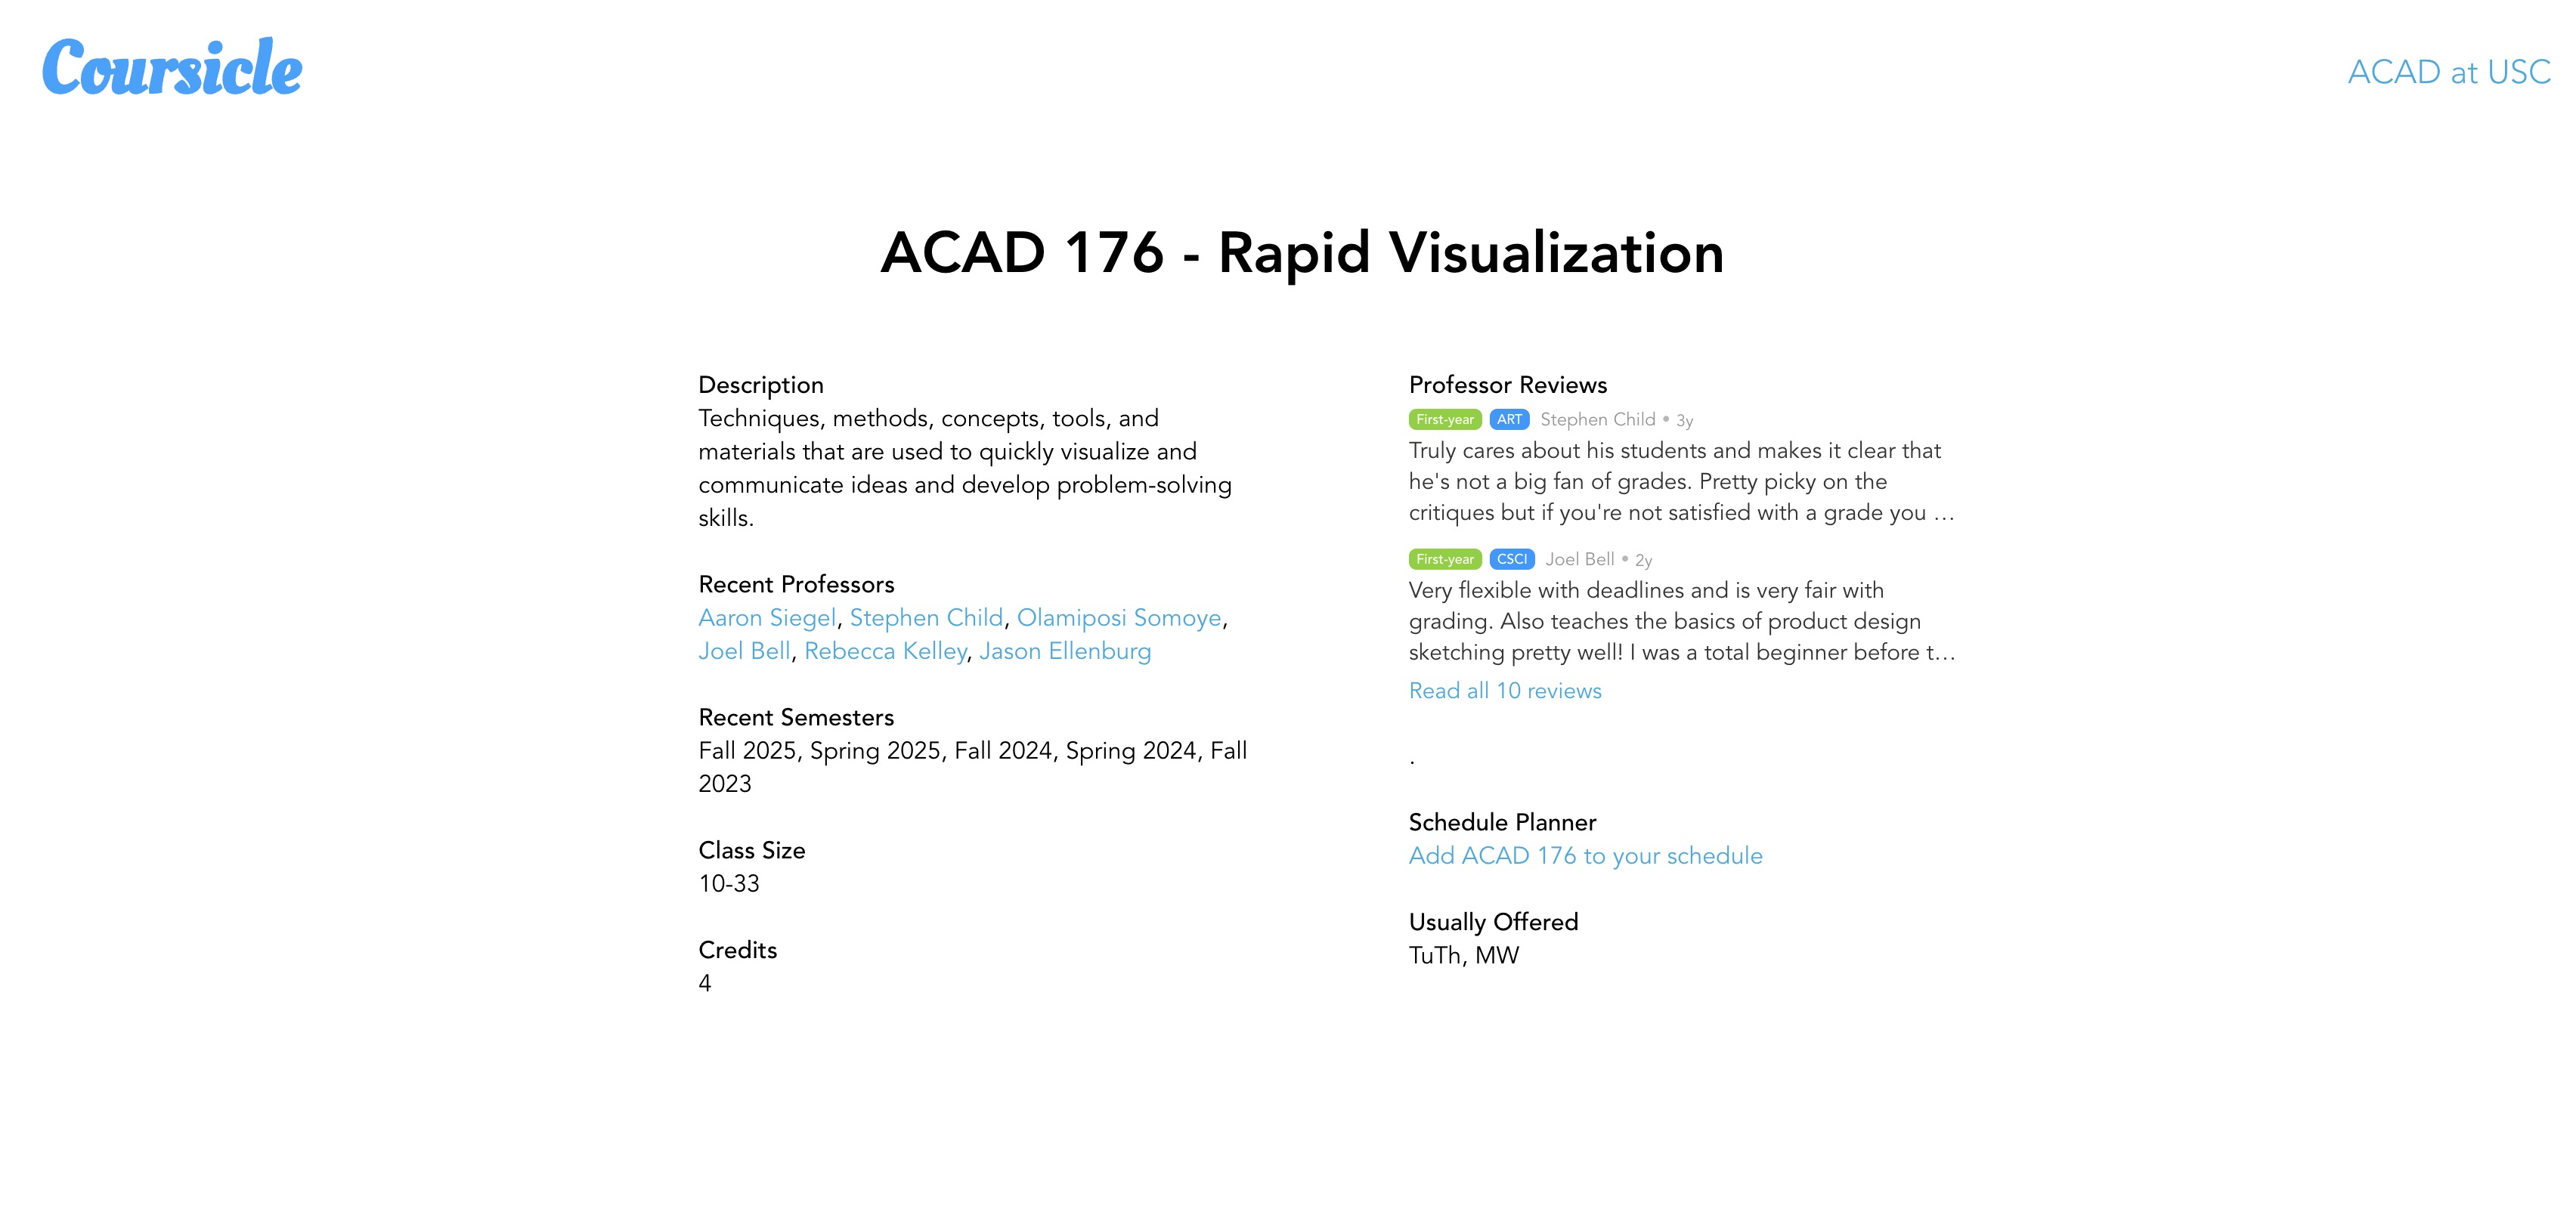
Sample course page (ACAD 176):
How to Use & Insights
Coursicle doesn’t have data for ratings but rather data of comments. It captures the essence, as most students looking to decide on a class for the entire semester will be willing to sacrifice time to look at the comments rather than just the ratings. It is an extremely well-supplemental resource for RMP, as it provides not only reviews but also descriptions. It is especially helpful for smaller classes that are less known (most IYA classes), as it provides more review data. With the combination of RMP and Coursicle, many classes which had too few stats add up to be statistically significant. This will help students spot trends and potential outliers more easily.
 Resource C — USC Official Syllabus (Web APP)
Insight
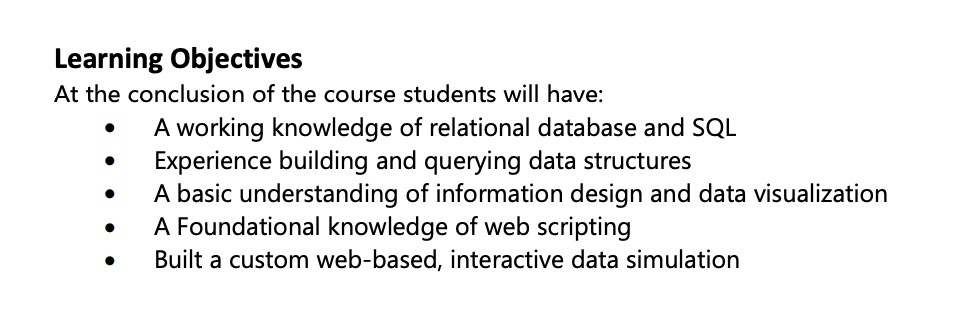
A highlight of learning objectives is helpful for students and families to gain insight into what the class will teach without reading the entire syllabus. It could be used conveniently to identify if this class is a good fit with your interests.
Insight
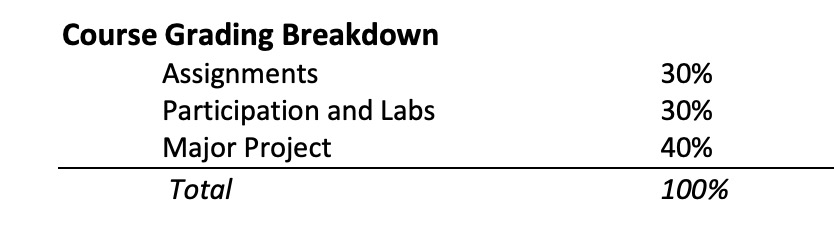
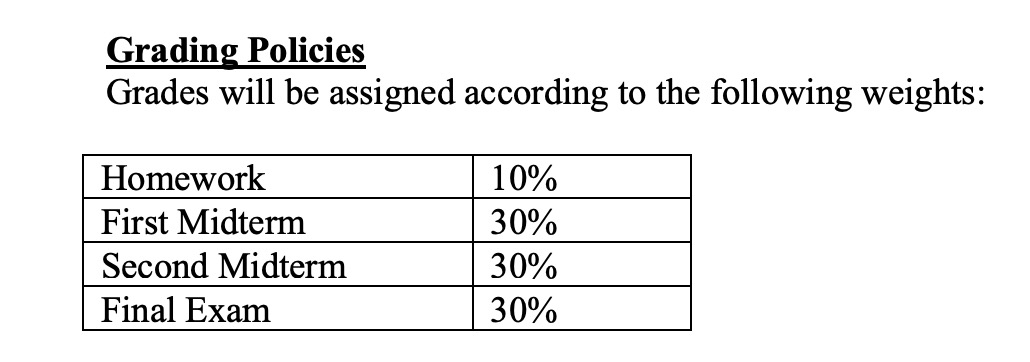
This data is one of the most valued areas as it provides direct insights into what the class is graded on. To compare, some classes are heavily graded on midterms and finals, while other classes, like most IYA courses, are graded on projects. For example, ACAD-274 has an even distribution based on participation, homework, and projects, while ECON-351 is nearly entirely based on exams. Some people prefer individual testing in concentrated exam weeks, while others might prefer group projects that extend over a longer period of time.
Insight
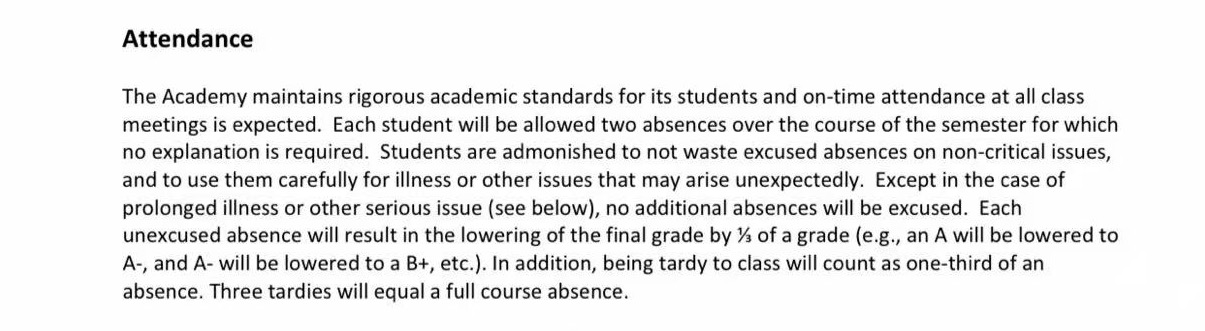
This data is what many students look for. They wonder if participation and attendance are mandatory. From the information in the screenshot, students can gain insights that ACAD-274 and other IYA courses heavily rely on participation, where attendance is mandatory. Yet, many larger classes with heavy reliance on exams tend to have non-mandatory attendance, requiring more self-management. This will all help with students’ decision-making of courses and even majors that fit their interests and personalities the most.
Comparison syllabus (ECON-351): https://web-app.usc.edu/soc/syllabus/20243/26307.pdf
Potential Action Items
- Students: Post only one comment per class. Weigh ratings by recency and # of reviews.
- Platform: Encourage richer and substansive comments and provide context pennels (highlighting outliers, low sample size, known biases) to reduce bias.
- Departments: Even if ratings/comments can’t accurately reflect a teacher’s education, this data could still help departments to achieve possible information on what student’s are looking for, such as “clear rubrics” and “fast email response.”
Suggestions for Improved Interactive Outputs
- Reliability bar next to every course/professor. Outliers should be treated skeptically and warnings on small sample sizes (same as actions for platform).
- Timeline & course differentiation. Some professors’ ratings shift over time and differ by course. Rating’s aren’t accurate as the professor might have a different expectation depending on the course. Right now RMP bundles everything together. Separating by term and course would better reflect current popularity/experience.
- Comparison feature Let users bin professor/courses where one can be compared to another through the form of tags and the bar graph rating distribution. Comparison is vital as the scale of 0-5 would be meaningless without it (just as there would be no evil if there’s no good, nor there would be good without evil).
- Customizable graphs(JSON) For a better interactive data, each school should have its own customizable search format. Right now, the only efficient way to locate a rating is by entering the professors name and course number. There should be subcategory that students can filter not just by departments but by majors/required credits.
- Accuracy validation. Add upvote/downvote on comments and simple reply threads where outliers can be spotted easily. Open-debate adds It adds more information and justifications to just the numbers alone.